
Grafana is the open-source analytics and monitoring solution for every database. in this post, we will learn how to install on OpenSUSE 15.1 as it is the operating system using in VICIBOX version 9 that is the latest version when I’m writing this post. The method will be almost the same for other SUSE versions as well.
The easiest way to install the latest version of Grafana on you Suse Linux is through the Zypper package manager. Grafana is not in the default package list of OpenSUSE so we need to add the repo.
The first step is to go to https://software.opensuse.org/package/grafana and find your exact version of OpenSUSE.

if you don’t know what is your precise version of OpenSUSE you can use the following command:
cat /etc/*release*

Select expert download and choose your SUSE distribution.

And you have all the commands that are needed for installing Grafana in openSUSE
vicibox9:~ #zypper addrepo https://download.opensuse.org/repositories/Cloud:OpenStack:Master/openSUSE_Leap_15.1/Cloud:OpenStack:Master.repo
vicibox9:~ #zypper refresh
vicibox9:~ #zypper install grafana
And now we need to enable and start Grafana service:
vicibox9:~ #systemctl enable grafana-servervicibox9:~ #systemctl start grafana-serverand make sure it is running successfully by running “systemctl status grafana-server” command.

Grafana server service should be run on port 3000. You can verify that by running the netstat command.
netstat -plntu | grep 3000

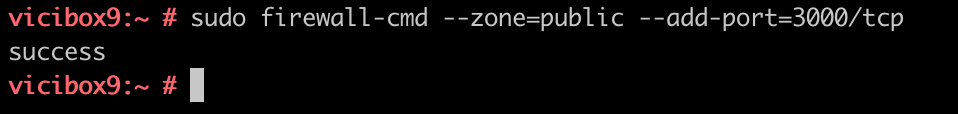
and you need to allow port 3000 in firewall in order to be able to access the Grafana Panel.
sudo firewall-cmd –zone=public –add-port=3000/tcp
Grafana is installed and you can access the panel on port 3000. The default username and password is admin.